
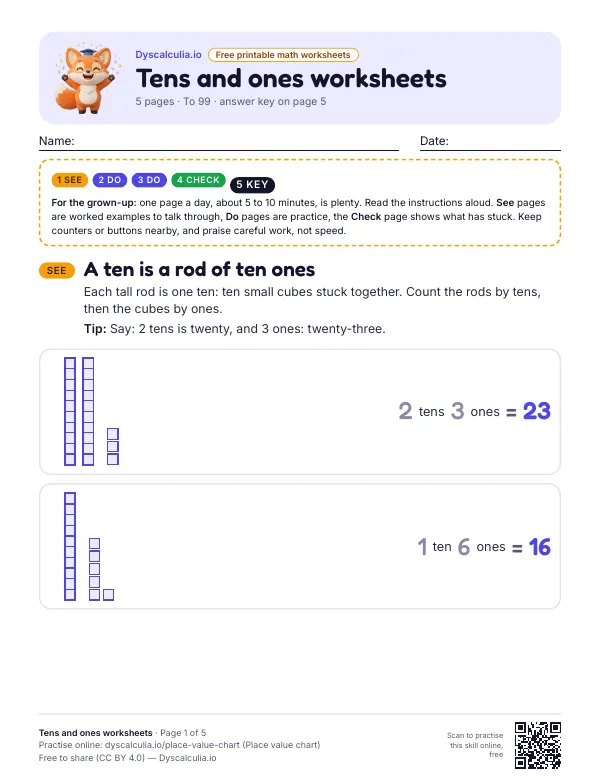
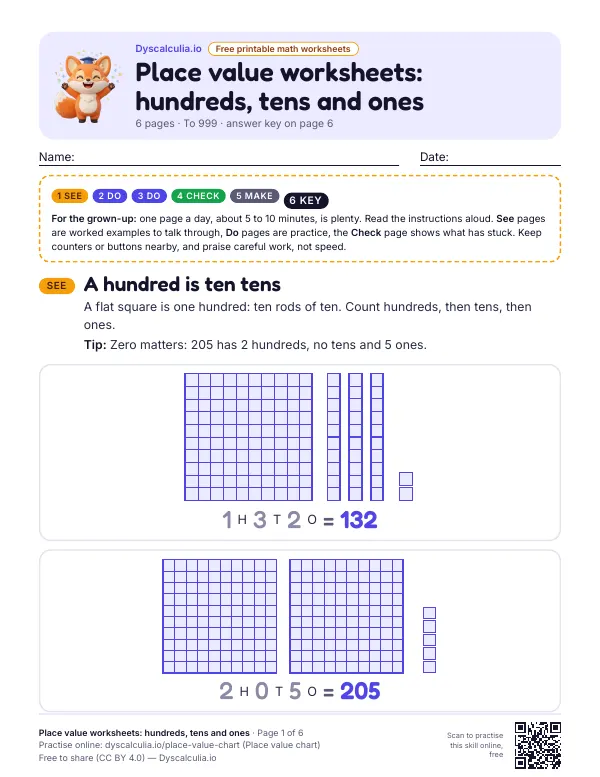
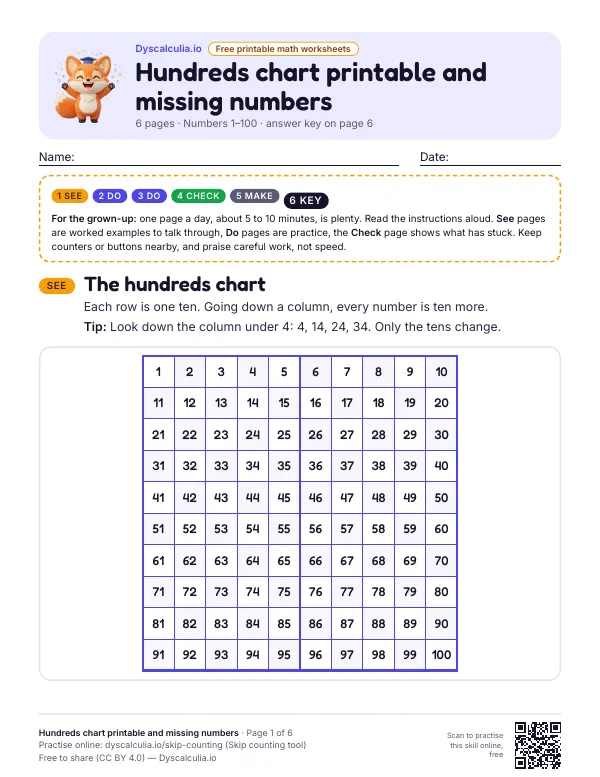
Short answer
What is a place value chart?
A place value chart is a table that sorts the digits of a number into columns by place: ones, tens, hundreds, thousands, ten thousands, hundred thousands and millions, and after the decimal point tenths, hundredths and thousandths. Each column is worth ten times the column to its right, so the same digit changes value as it moves left. In 3,405 the 3 is worth 3,000, the 4 is worth 400, the 0 holds the tens place and the 5 is worth 5. Dyscalculia.io's free interactive place value chart fills in any number up to the millions, shows each digit's value and the expanded form, and prints blank or filled.
×10
each place is worth ten times the place to its right (Common Core 5.NBT.A.1)1
Strong
evidence level the U.S. What Works Clearinghouse gives visual representations, such as place value charts, in maths intervention2
Grade 1 → 3
place-value understanding in first grade predicted parts of addition performance two years later3
- Each place is worth 10 times the place to its right and one tenth of the place to its left.
- Whole-number places are grouped in threes called periods: ones, thousands, millions.
- A 0 is a placeholder: 3,405 and 345 have the same non-zero digits but different values.
- Decimal places go tenths, hundredths, thousandths, not 'oneths'.
- Free, no sign-up, printable, and nothing you type leaves your browser.
How to use a place value chart
The same five steps work on paper, on a whiteboard or with the interactive chart above. Start with two- and three-digit numbers before moving to thousands and decimals.
- 1
Start from the ones
Write the last digit of the whole number in the ones column, or the digit just before the decimal point if there is one.
- 2
Fill the columns to the left
Put each digit one column further left: tens, hundreds, thousands. Every digit gets exactly one column, zeros included.
- 3
Place the decimals to the right
After the decimal point the digits go into tenths, hundredths and thousandths, in that order.
- 4
Say the value of each digit
Read each digit with its column: 4 in the hundreds place is 400, 2 in the tenths place is 0.2.
- 5
Write the expanded form
Add the values back together to check: 3,405 = 3,000 + 400 + 5. If the sum is the starting number, every digit is in the right place.
Place value chart columns from millions to thousandths
Our number system has ten digits, 0 to 9, and the position of a digit decides what it is worth. A place value chart makes that position visible. Moving one column to the left multiplies the value by 10; moving one column to the right divides it by 10. That rule runs all the way from the millions down to the thousandths, with the decimal point sitting between the ones and the tenths.
Whole-number places are grouped in threes called periods. Each period has its own ones, tens and hundreds: the ones period (ones, tens, hundreds), the thousands period (thousands, ten thousands, hundred thousands) and the millions period. The commas in 1,234,567 mark where one period ends and the next begins, which is why the chart above colours each period differently.1,4
| Place | Value of 1 in this place | A 7 in this place is worth |
|---|---|---|
| Millions | 1,000,000 | 7,000,000 |
| Hundred thousands | 100,000 | 700,000 |
| Ten thousands | 10,000 | 70,000 |
| Thousands | 1,000 | 7,000 |
| Hundreds | 100 | 700 |
| Tens | 10 | 70 |
| Ones | 1 | 7 |
| Tenths | 0.1 | 0.7 |
| Hundredths | 0.01 | 0.07 |
| Thousandths | 0.001 | 0.007 |
Place value chart examples
These are the example numbers in the interactive chart. Zeros are where most children go wrong, so three of the five have a zero inside them. Click any example above to see it in the chart with the value of every digit.
| Number | Digits by place | Expanded form |
|---|---|---|
| 3,405 | 3 thousands, 4 hundreds, 0 tens, 5 ones | 3,000 + 400 + 5 |
| 70,060 | 7 ten thousands, 0 thousands, 0 hundreds, 6 tens, 0 ones | 70,000 + 60 |
| 1,234,567 | 1 million, 2 hundred thousands, 3 ten thousands, 4 thousands, 5 hundreds, 6 tens, 7 ones | 1,000,000 + 200,000 + 30,000 + 4,000 + 500 + 60 + 7 |
| 48.25 | 4 tens, 8 ones, 2 tenths, 5 hundredths | 40 + 8 + 0.2 + 0.05 |
| 0.307 | 0 ones, 3 tenths, 0 hundredths, 7 thousandths | 0.3 + 0.007 |
Place value chart with decimals
The decimal places mirror the whole-number places around the ones column: tens on one side, tenths on the other; hundreds on one side, hundredths on the other. There is no 'oneths' column, which is why the ones place, not the decimal point, is the centre of the chart.
Reading decimals from a chart avoids the most common comparison mistake. 0.3 and 0.25 look as if 25 should beat 3, but in the chart the 3 sits in the tenths column and the 2 in the same column is smaller, so 0.3 is the larger number. Turn on 'Show decimals' in the tool above and type both to compare them column by column. In US standards decimals to thousandths, including expanded form, are a grade 5 topic.1
Common place value mistakes and how the chart shows them
Most place value errors come from treating a number as a string of digits rather than a set of amounts. These are the ones teachers see most often, and each one is visible as soon as the digits are in columns.
- Dropping a zero: writing four thousand and five as 405. In the chart the 4 lands in the hundreds column and the thousands column is empty, so the mistake shows.
- Writing numbers as they sound: three thousand four hundred five written as 3000405. One digit per column stops the extra zeros.
- Mixing up tens and tenths: the words sound alike, but the columns sit on opposite sides of the ones.
- Thinking a longer decimal is bigger: 0.25 is less than 0.3, because the tenths digit decides first.
- Lining up numbers from the left when adding or subtracting: columns line up from the ones (or the decimal point), not from the first digit.
- Reading the digit, not its value: in 5,830 the 8 is not '8' but 800.
How a place value chart helps children who struggle with maths
The U.S. What Works Clearinghouse practice guide for students who struggle with mathematics gives a strong level of evidence to using a well-chosen set of concrete and semi-concrete representations, and it names the place value chart as the semi-concrete representation for place value, next to base-10 blocks as the concrete one. A sensible order is blocks or bundles of ten first, then the chart, then digits alone.
Place value matters early. In a longitudinal study of German-speaking children, place-value understanding in first grade predicted specific aspects of addition performance in third grade. A chart does not fix a broad difficulty with numbers on its own, but it takes the guesswork out of where each digit goes.
If a child still struggles with the size of numbers after plenty of practice, for example comparing 45 and 54 or placing numbers on a line, those are basic number sense skills. The free dyscalculia test checks five of them in about ten minutes, and dyscalculia exercises and number sense activities show what to practise next. For numbers to 10 and 20, the ten frame and number bonds tools build the same idea of tens and ones.2,3